Requirements:
- Cloudflare account
- Command line tool such as Command on a Windows machine, and Terminal or iTerm on a Mac
- Appropriate access level privileges to your Cloudflare.com so you can source identifying keys such as the (Zone ID and API keys which you will need).
We are going to use a Cloudflare API called "Analytics dashboard API". This analytics dashboard API will give you a bunch of analytics that you would normally see in your dashboard, however, I am going to focus on showing you how to get your bandwidth numbers, including the cached and uncached bandwidth figures.
You can always view more analytics fields and other optional parameters by following the steps on the Cloudflare API page: https://api.cloudflare.com/#zone-analytics-dashboard
What is the Cloudflare Analytics Dashboard?
The dashboard view provides both totals and timeseries data for the given zone and time period across the entire Cloudflare network.
How do we retrieve data from the Analytics Dashboard?
To retrieve data we need to run a GET command. The following is an example curl GET command you would be using to pull from Cloudflare.
curl -X GET "https://api.cloudflare.com/client/v4/zones/example-API-key/analytics/dashboard?since=2015-01-01T12:23:00Z&until=2015-01-02T12:23:00Z&continuous=true"
-H "X-Auth-Email: user@example.com"
-H "X-Auth-Key: example-API-key"
-H "Content-Type: application/json"
Cloudflare Analytics Dashboard
HTTP Method: GET
GET zones/:zone_identifier/analytics/dashboard
Step 1 - Find your Zone ID and API key
Zone ID - ZONE-ID-XYZ-HERE (you'll find this in your Cloudflare portal)
API key - API-ID-XYZ-HERE (you'll find this in your Cloudflare portal)
Step 2 - Run an API call - curl command
-H "X-Auth-Email: YOUR-EMAIL-ADDRESS-HERE"
-H "X-Auth-Key: API-ID-XYZ-HERE"
-H "Content-Type: application/json"
Step 3 - Add output to API call
curl -X GET "https://api.cloudflare.com/client/v4/zones/ZONE-ID-XYZ-HERE/analytics/dashboard?since=2017-01-01T12:23:00Z&until=2017-01-30T12:23:00Z&continuous=true"
-H "X-Auth-Email: YOUR-EMAIL-ADDRESS-HERE"
-H "X-Auth-Key: API-ID-XYZ-HERE"
-H "Content-Type: application/json" | jq '.result.timeseries[] | [.until, .bandwidth.all, .bandwidth.cached, .bandwidth.uncached] |@csv' > ~/Desktop/output.csv
Step 4 - Check your output file
You should put your output file (output.csv) into a spreadsheet tool such as Google Sheets or Microsoft Excel. Make sure there is data in there to work with.
Step 5 - Review your spreadsheet and set bandwidth columns
Once you have confirmed there is data in the spreadsheet file you have downloaded, convert the desired amount into the metrics you are keen to look at the data by. This will allow you to make sense of the bunch of long numbers you'll see.
Be that in:
Bytes, Kilobytes, Megabytes, Gigabytes or Terabytes
1 Byte = 8 Bit
1 Kilobyte = 1,024 Bytes
1 Megabyte = 1,048,576 Bytes
1 Gigabyte = 1,073,741,824 Bytes
1 Terabyte = 1,099,511,627,776 Bytes
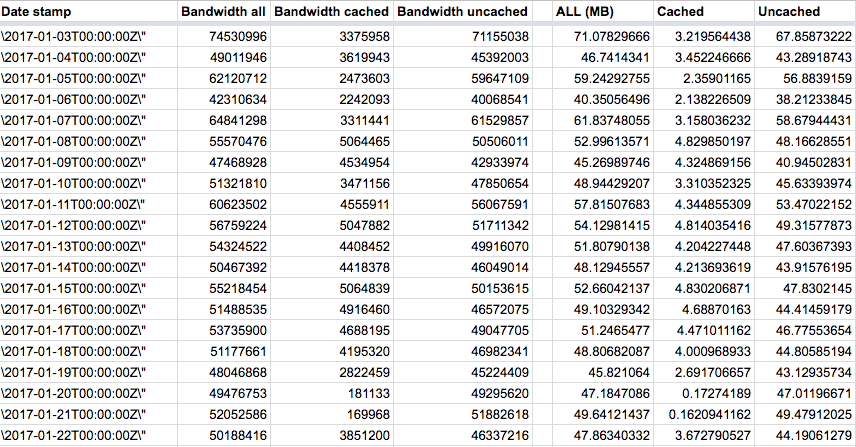
Here is an example spreadsheet I created using GoogleSheets.
I divided the "Bandwidth all" column field with the Megabyte number (1,048,576) to give me the "ALL (MB)" column you see in the screenshot below. Then I did the same for the bandwidth cahced and bandwidth uncached columns.
You can choose to divide it by another metric, depending on how large or small the number you see in your spreadsheet is.
Well done!
So there you have it. You now have stats to work with.


